Cornish Pasty vs Pork Pie: Calories, Fat, Sodium
Cornish pasty vs pork pie per 100 g: 262 vs 376 kcal, 14.5 vs 26.5 g fat. Two British hand-held meat pies — and which travels better.
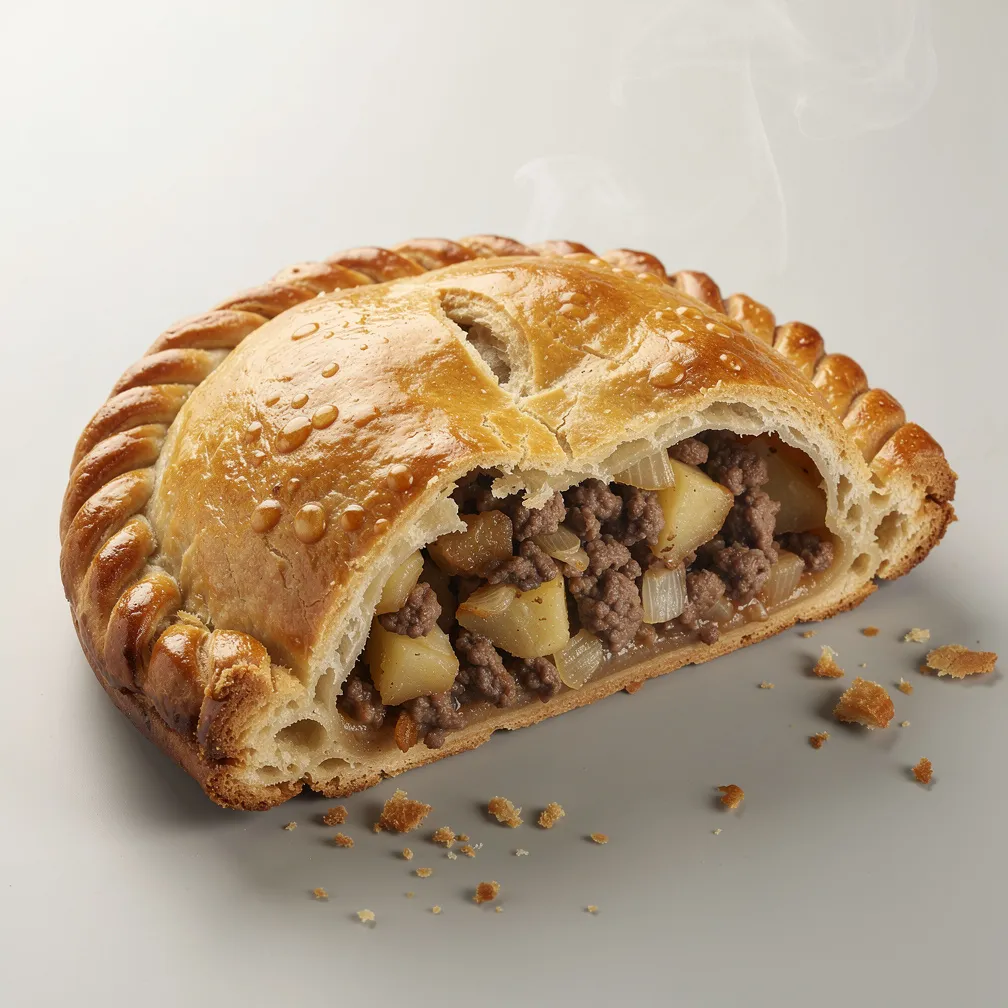
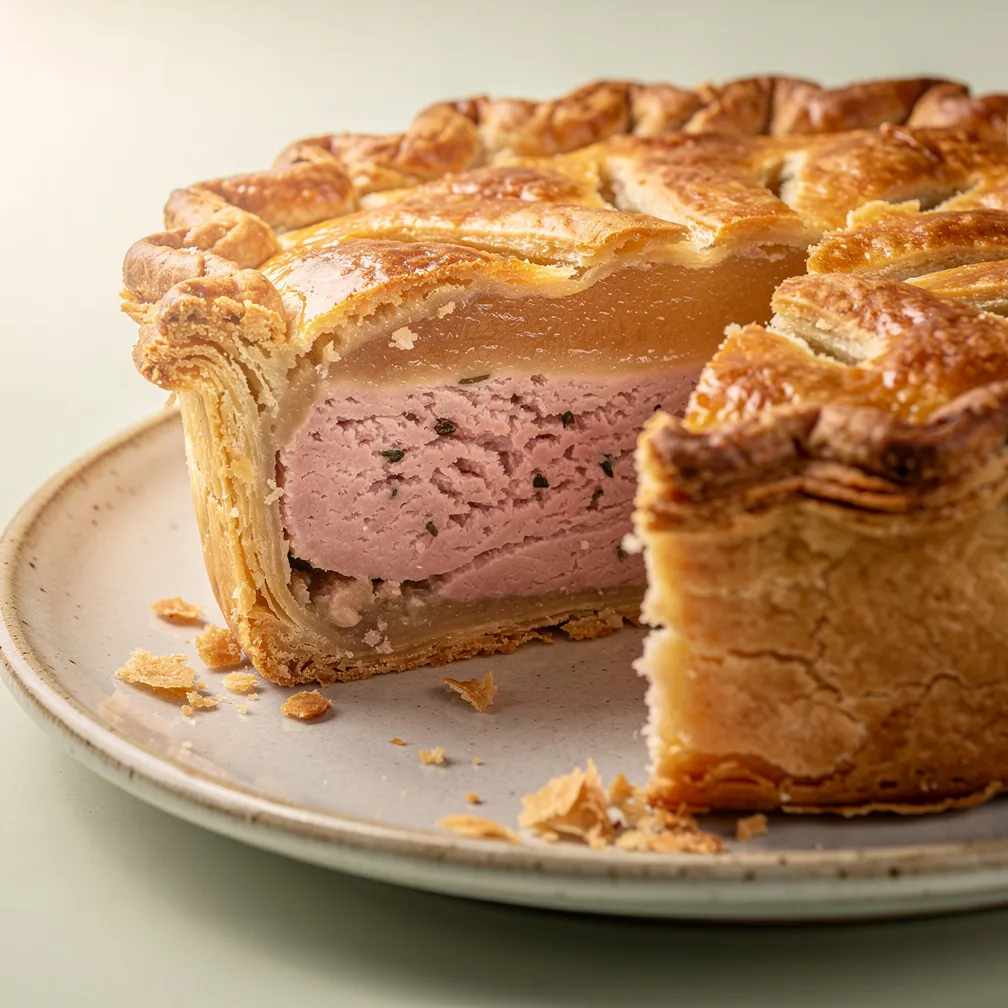
The Cornish pasty and the pork pie are the two iconic British hand-held meat pies — Cornwall's tin-miner lunch vs Melton Mowbray's market-day staple. Both come ready to travel, both eat cold or hot, both pack a meal into a pastry shell. But the nutritional comparison is stark. Per 100 g, the pork pie hits 376 kcal vs the pasty's 262 — 43 % more calorie-dense — and carries 26.5 g of fat vs 14.5 g.
The structural reason is meat-to-pastry ratio and meat preparation. The pork pie is hot-water-crust pastry surrounding a heavily seasoned pork forcemeat with a layer of gelled stock. The pasty is shortcrust pastry around a mix of beef, potato, swede, and onion — far more vegetable mass, far less concentrated protein.
Quick comparison
| Per 100 g | Cornish pasty | Pork pie |
|---|---|---|
| Calories | 262 kcal | 376 kcal |
| Protein | 9.8 g | 13.5 g |
| Fat | 14.5 g | 26.5 g |
| Saturated fat | 6.2 g | 10.2 g |
| Carbohydrate | 25.2 g | 22.5 g |
| Sugars | 1.8 g | 1.2 g |
| Fiber | 1.9 g | 0.9 g |
| Sodium | 480 mg | 780 mg |
| Potassium | 260 mg | 195 mg |
| Calcium | 28 mg | 28 mg |
| Iron | 1.8 mg | 1.4 mg |
| Vitamin C | 5.5 mg | 0.0 mg |
Macros and calories
A typical 220 g Cornish pasty = 576 kcal. A typical 150 g pork pie = 564 kcal. The dishes converge at the typical serving size because the pork pie's smaller portion compensates for its higher density. As lunchtime calorie payloads, they're roughly equal — about a quarter of a daily 2,000 kcal target.
Protein lands higher in the pork pie (13.5 vs 9.8 g per 100 g) because it's almost pure meat by filling weight. The pasty's filling is around 50 % vegetable by weight, which dilutes the protein density.
The carbohydrate split is unexpected — the pasty edges higher (25.2 vs 22.5 g per 100 g) because potato and swede are starchy, while pork pie's filling is essentially carb-free meat. Across portions, the carbs roughly tie.
Saturated fat is the pork pie's worst number: 10.2 g per 100 g. A 150 g pork pie delivers 15.3 g of saturated fat — 70 % of the WHO daily allowance for a 2,000 kcal diet. The pasty's 6.2 g per 100 g is moderate; the same 220 g serving delivers 13.6 g sat fat.
Vitamins and minerals
The Cornish pasty wins almost every micronutrient column. Vitamin C at 5.5 mg vs 0 mg in the pork pie — the pasty's swede and potato retain some C through the bake; the pork pie has no vegetables. Potassium at 260 vs 195 mg — pasty's vegetables again. Iron at 1.8 vs 1.4 mg — close, edged by the pasty's beef and the trace iron from potatoes.
Sodium is the most lopsided number. The pork pie at 780 mg per 100 g is one of the saltiest dishes in British cuisine — the forcemeat is heavily seasoned for shelf stability and the hot-water crust adds more salt. A 150 g pork pie = 1,170 mg sodium, almost 60 % of the WHO daily target.
The Cornish pasty at 480 mg per 100 g is moderate; 220 g serving = 1,056 mg, similar total but spread across a much larger meal.
Fiber and meal architecture
The pasty carries 2× the fiber per 100 g (1.9 vs 0.9 g). For a hand-held lunch, that fiber comes from real vegetable matter — swede and potato together provide a meaningful contribution. The pork pie offers essentially zero fiber and zero vegetable.
This is why nutritionists treat the pasty as closer to a complete meal and the pork pie as closer to a snack-bracket meat-and-pastry combination that needs a side salad to count as lunch.
Diet compatibility
| Diet | Cornish pasty | Pork pie |
|---|---|---|
| Vegan | No | No |
| Vegetarian | No (beef) | No (pork) |
| Gluten-free | No (pastry) | No (pastry) |
| Dairy-free | Borderline (butter) | Yes |
| Paleo | No (pastry, potato) | No (pastry) |
| Mediterranean | No | No (sat fat) |
| Keto | No (25 g carbs) | No (22.5 g carbs) |
| Low-FODMAP | Borderline (onion) | Borderline |
Neither hand pie fits a strict-diet pattern. Gluten-free versions exist for both, generally with shorter shelf life and inferior texture. Vegetable-only Cornish pasties (vegetarian regional variants) cut animal fat and protein but keep the pastry's calorie load intact.
When to choose Cornish pasty
- 43 % fewer calories per 100 g — more sensible lunch portion.
- 39 % less saturated fat — meaningfully friendlier on lipid profile.
- 2× the fiber — actual digestive support, not just pure meat-and-pastry.
- Vitamin C (5.5 mg per 100 g) — the pork pie has zero.
- 33 % more potassium — minor but real mineral contribution.
When to choose pork pie
- 38 % more protein per 100 g — denser per-bite protein delivery.
- Convenient single-serving format — a 150 g pie is a perfect lunch slot.
- Shelf-stable at room temperature for several hours — true picnic food.
- Distinct hot-water-crust texture you cannot get in any other pastry.
- Pairs uniquely well with English mustard, branston pickle, or a sharp cheese.
Practical pairings
The Cornish pasty is a complete meal — pastry, meat, vegetable starch, all in one wrapping. The only thing it really needs is a piece of fruit and a glass of water. Skip the chips on the side; a 220 g pasty is enough carbs already.
The pork pie, by contrast, is a building block. Traditional accompaniments are branston pickle, English mustard, pickled onions, and a sharp piccalilli. These add minimal calories (most under 30 kcal per tablespoon) but significantly improve the eating experience and add vegetable matter.
For a picnic spread: one pork pie + 100 g salad + an apple = roughly 700 kcal complete lunch. For a hike or long shift: a Cornish pasty is a single-item self-contained meal that doesn't need packing extras.