Why 'Cooked Chicken' and 'Raw Chicken' Are Different Foods
Why raw and cooked rice differ in calories by 3×, how cooking changes the nutrient profile, and why trackers get state wrong.
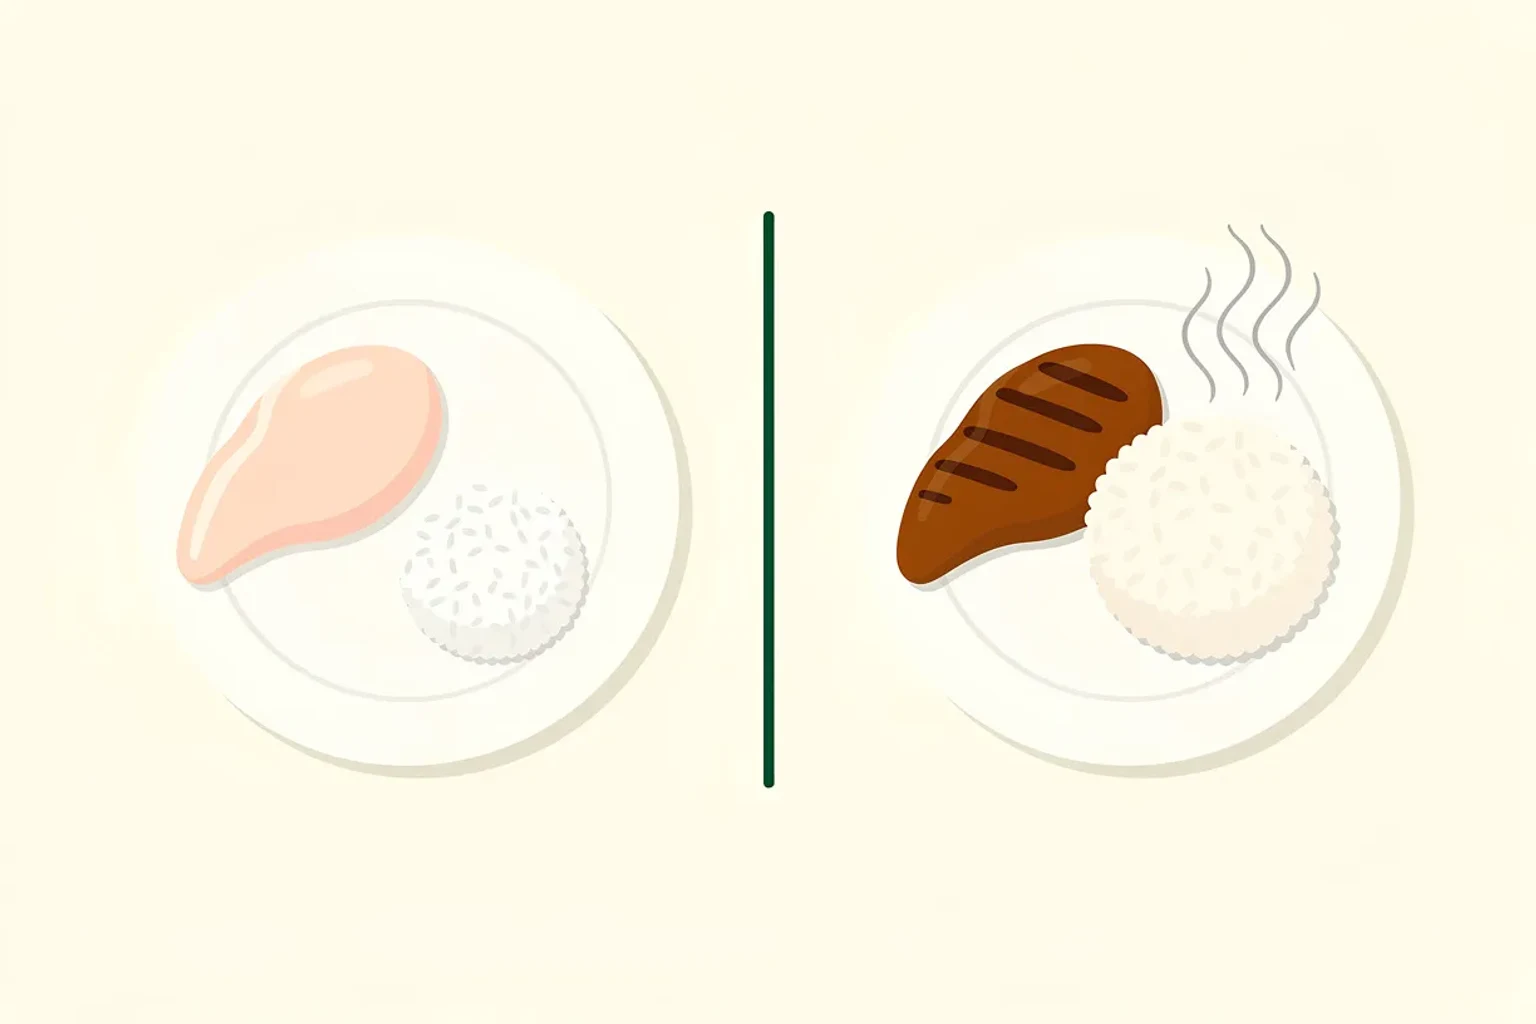
Raw chicken breast — 165 kcal per 100 g. Cooked chicken breast — 195 kcal per 100 g. Same physical chicken, same bird. Where does the 18 % difference come from?
The answer: cooking drives off water. Per 100 g, cooked chicken carries more dry matter (protein, fat) than raw chicken. Calories per gram are higher — simply because the grams contain less water.
This is a detail most trackers paper over. That's why in Vnutri, a single "chicken" technically is 4–5 different records: raw, cooked, baked, grilled, fried. Each has its own per-100-g profile.
What cooking changes
Three effects.
- Water loss. Boiling, baking, grilling, frying evaporate water. All nutrients concentrate per unit weight. Calories, protein, fat — all rise.
- Heat-labile nutrient breakdown. Vitamins C and B1 (thiamine) degrade with heat. B2, B6, B12 — partially. Minerals (calcium, iron, zinc) — stable.
- Bioavailability. Some nutrients become more available after cooking. Carotenoids in carrots (beta-carotene) absorb 2–3× better from cooked carrots than raw. Lycopene in tomatoes — same.
These effects pull in different directions, and the net result depends on the food and the method.
Concrete examples
Chicken breast (per 100 g):
| State | Calories | Protein | Fat | Water |
|---|---|---|---|---|
| Raw | 165 | 31 g | 3.6 g | 75 % |
| Boiled | 195 | 31 g | 4.4 g | 65 % |
| Fried | 220 | 32 g | 8.2 g | 60 % |
Notice that boiled and raw show equal protein per 100 g (31 g)? That's because protein concentrates as water leaves — but some also leaches into the cooking liquid. In reality, 100 g of raw chicken yields ~75 g cooked, and those 75 g contain about 25 g of protein. So "more protein in cooked chicken" is a per-100-g illusion.
Rice (per 100 g):
| State | Calories | Carbs | Water |
|---|---|---|---|
| Dry | 358 | 80 g | 12 % |
| Cooked | 130 | 28 g | 68 % |
Here it's the opposite: rice absorbs water during cooking (about 2.5–3× by weight). 100 g of dry rice yields ~280 g cooked. Per 100 g cooked, calories drop by 2.75×.
Spinach (per 100 g):
| State | Calories | Calcium | Iron |
|---|---|---|---|
| Raw | 23 | 99 mg | 2.7 mg |
| Boiled | 23 | 136 mg | 3.6 mg |
| Sautéed (in oil) | 95 | 200 mg | 5.3 mg |
Spinach loses ~80 % of its volume to water release. Calories per 100 g stay close to flat, but mineral density rises in line with water loss.
Potato (per 100 g):
| State | Calories | Carbs | Vitamin C |
|---|---|---|---|
| Raw | 77 | 17 g | 19.7 mg |
| Boiled | 87 | 20 g | 13 mg |
| Baked | 93 | 21 g | 9.6 mg |
| Fried | 312 | 41 g | 7.1 mg |
Vitamin C drops (heat-labile), and calories rise from concentration plus added fat in frying.
What states Vnutri tracks
Vnutri uses a state-variant model. Each food carries one of 10 states:
raw— uncooked, untreatedcooked— boiled or simmereddried— dehydrateddry— uncooked dry form (dry pasta, dry rice)baked— bakedgrilled— grilledroasted— roasted (oven)stewed— stewedbraised— braisedfried— pan-fried in oil
"Smoked", "canned", "pickled", "cured", "sun-dried" are not states. They're separate foods (smoked salmon ≠ salmon, smoked). They get their own catalog entries with their own groupIds.
Group ID — the shared key for siblings
Every state variant shares a groupId. Apple raw, Apple cooked, Apple dried → groupId = apple. This drives the UX: the list shows a single "representative" per group (usually raw), and the detail screen has a state switcher.
The primary selection rule: raw > cooked > dried > dry > baked > grilled > roasted > stewed > braised > fried, tie-break by popularity desc → EN name asc.
This one-row-per-group logic is important for UX:
- Without it the catalog looks like 4,000 entries with duplicate "apple", "apple cooked", "apple baked".
- With it — 845 "foods" with states as a parameter on the detail page.
Why it matters for trackers
Most calorie trackers ask "100 g of chicken breast" without specifying raw or cooked. That's a 30 kcal × 7 times a week = 1,470 missing calories per week. For someone losing weight, that's the difference between a 500/day deficit and a 300/day deficit.
Vnutri handles this with an explicit state selector on the detail page. When you log chicken, you pick the state: raw / cooked / grilled / fried. Each is its own record with its own nutrition.
Rule of thumb: log the state you actually ate. Logging "raw chicken breast" and then eating 100 g cooked underreports calories by about 18 %.
Accounting for mass loss
If you know the raw weight and ate it cooked, account for mass loss.
Typical loss factors:
| Food | Raw → cooked (weight) |
|---|---|
| Chicken, boiled | × 0.75 (loses ~25 %) |
| Chicken, fried | × 0.70 (loses ~30 %) |
| Beef steak (medium-rare) | × 0.82 |
| Salmon, baked | × 0.85 |
| Rice, boiled | × 2.8 (absorbs 180 %) |
| Pasta, boiled | × 2.4 |
| Potato, boiled | × 0.93 (loses 7 % water) |
| Potato, baked | × 0.80 |
| Spinach, sautéed | × 0.20 (loses 80 % volume) |
| Cabbage, stewed | × 0.30 |
If you weighed 200 g of raw rice, you'll get ~560 g cooked after boiling — that's 728 kcal (not 716 kcal as 200 × 3.58 = 716, close but not identical due to cooking losses).
Most people log post-cooking — easier in practice. In that case pick state = "cooked" and weigh the portion.
Raw vs cooked for different nutrients
Not every nutrient behaves the same way.
- Calories, protein, fat — rise per 100 g when cooked (concentration).
- Carbs in starchy foods — rice/potato can rise (absorbed water) or fall (leaching). Depends on method.
- Vitamin C, B1, folate — drop with heat (up to −50 %).
- Minerals — stable, concentrate with water loss.
- Lycopene (tomato), beta-carotene (carrot) — bioavailability rises with cooking.
- Antinutrients (phytates in legumes, oxalates in spinach) — partially destroyed by boiling, freeing up minerals.
See the iron sources guide — raw vs cooked makes a visible difference there.
And dried foods?
Dried foods are a separate category. Not "cooked", not "raw". They're dried, and nutrient density rises 5–10× because almost all the water has gone.
Dates (per 100 g):
| State | Calories | Sugars |
|---|---|---|
| Fresh | 142 | 19.3 g |
| Dried | 282 | 63 g |
100 g dried = ~200 g fresh. Often missed in tracking — "20 g of dried fruit" is easy to eat, but it's equivalent to 50 g of fresh fruit on sugars.
In the catalog, dried foods live in their own state branch. Apple dried is a separate record from Apple raw.
Cooked promotion
A technical detail: in Vnutri's pipeline, a cooked variant of a food bypasses the usual filters (minimum 2 sources, popularity) if raw has already passed. That gives us a complete state set for popular foods, even where there are fewer sources on the cooked variant.
Without that rule, "boiled buckwheat" would drop from the catalog — it's rarely published separately, more often as "buckwheat raw".
Limits
Frying with oil adds the food's fat to the oil's fat. Our "fried" values assume a typical average (1–2 tbsp of oil). If you deep-fry in a litre of oil, actual calories run higher.
Roasting with seasoning isn't reflected. "Roasted chicken" in the catalog is plain chicken — no marinades, sauces, or glaze sugar.
Region-specific cooking. "Boiled potato" in the catalog is a median across boiling methods. Russian dishes with butter, sour cream, and dill on top are dishes, not products.
How it appears in Vnutri
The list view shows one representative per group. The detail screen has a state switcher (if there's more than one).
Searching for "chicken" returns the chicken group; from the detail, you pick a state. One group covers many cooking scenarios.
Full data architecture overview — where our data comes from.
References
- US Department of Agriculture. FoodData Central. 2024.
- USDA ARS. Table of Cooking Yields for Meat and Poultry. Agriculture Handbook No. 102. 2014.
- USDA ARS. Cooking yields and retention factors for vitamins and minerals. 2009.
- Food Standards Australia New Zealand. Cooking factors for the AUSNUT 2011-13 food composition database. 2013.
- Public Health England. McCance and Widdowson's The Composition of Foods Integrated Dataset 2021.